Print eps figure with accent in matlab
2 min
Matlab is a powerfull software to plot images in different styles and formats. For this reason, researchers use it to make graphics to their papers. The eps format is one of the best to present it in papers or presentations. We usually add text in the image as the axis labels, titles or texts in certain positions. It can be done in image with arbitrary axis or in maps with latitude and longitude axis.
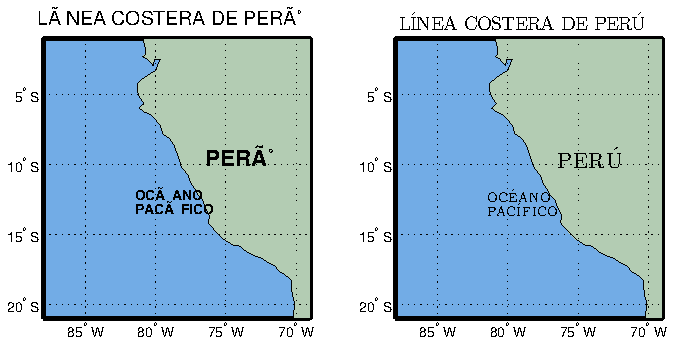
However, there are problems at exporting images as .eps format when we use accent in any kind of text that was put in the image. So, here I present a way to export eps format images using LaTex option directly in matlab.
% clear all before starting
clc, clear all, close all;
% load coast and map parameters
load coast;
subplot(1,2,1)
axesm('MapProjection','pcarree',...
'FLineWidth',2.5,...
'Frame','on',...
'MLineLocation',5,...
'PLineLocation',5,...
'Grid','on',...
'MapLatLimit',[-21 -1],...
'MapLonLimit',[-88 -69],...
'MeridianLabel','on', ...
'ParallelLabel','on',...
'GAltitude',5,...
'MLabelParallel','south');plotm(lat,long)
% plot the world coastlines in regions
patchesm(lat,long,[.7 .8 .7]);
tightmap;
% add ocean color
setm(gca,'ffacecolor',[114 172 230]/255)
% add some text in latex format
textm(-9.5,-76.5,'PERÚ','FontSize',16,'fontWeight','bold')
textm(-12.2,-81.5,'OCÉANO','FontSize',10,'fontWeight','bold')
textm(-13.2,-81.5,'PACÍFICO','FontSize',10,'fontWeight','bold')
% add title if wished
title('LÍNEA COSTERA DE PERÚ','FontSize',14)
subplot(1,2,2)
axesm('MapProjection','pcarree',...
'FLineWidth',2.5,...
'Frame','on',...
'MLineLocation',5,...
'PLineLocation',5,...
'Grid','on',...
'MapLatLimit',[-21 -1],...
'MapLonLimit',[-88 -69],...
'MeridianLabel','on', ...
'ParallelLabel','on',...
'GAltitude',5,...
'MLabelParallel','south');plotm(lat,long)
% plot the world coastlines in regions
patchesm(lat,long,[.7 .8 .7]);
tightmap;
% add ocean color
setm(gca,'ffacecolor',[114 172 230]/255)
% add some text in latex format
textm(-9.5,-76.5,'PER\''{U}','FontSize',16,'fontWeight','bold','interpreter','LaTex')
textm(-12.2,-81.5,'OC\''{E}ANO','FontSize',10,'fontWeight','bold','interpreter','LaTex')
textm(-13.2,-81.5,'PAC\''{I}FICO','FontSize',10,'fontWeight','bold','interpreter','LaTex')
% add title if wished
title('L\''INEA COSTERA DE PER\''U','FontSize',14,'interpreter','LaTex')
% export the figure in eps format
print -depsc prueba
Left image was made without using latex interpreter and right image was developed with the option LaTex interpreter. As you can see, the principal key is to add the option (‘interpreter’,‘Latex’) to text functions as title(), xlabel(), ylabel(), text(), textm(),and others. The image above is not the real resolution printed with matlab becouse I had to convert it to .png format in order to upload it to this post.
