Draws MCMC traceplots (iteration vs. value) directly from a fitted
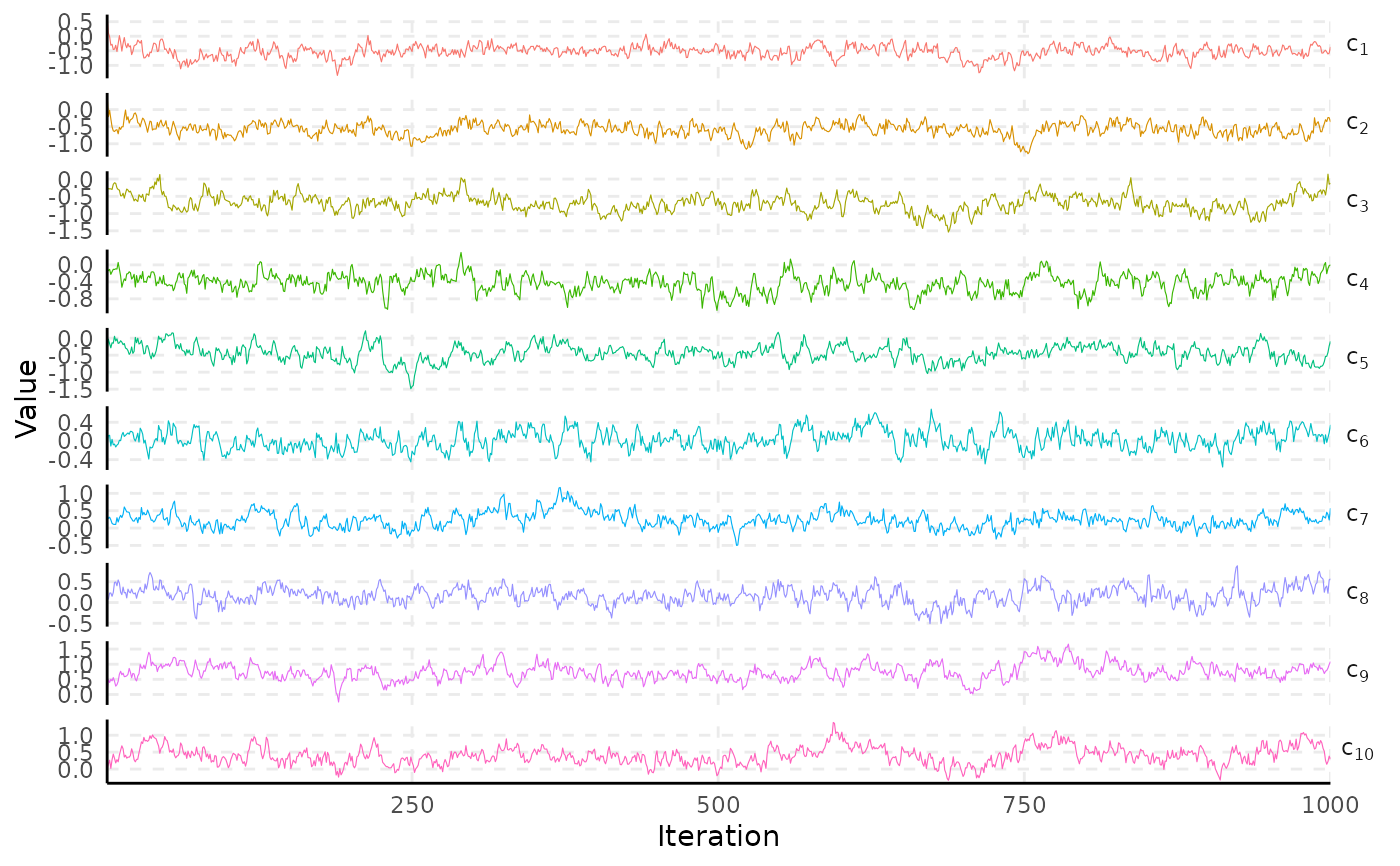
spifa model, in one of two formats: faceted (facet = TRUE,
the default; one panel per parameter, with its own free y-scale, so a
slow-mixing or small-variance parameter isn't visually flattened by
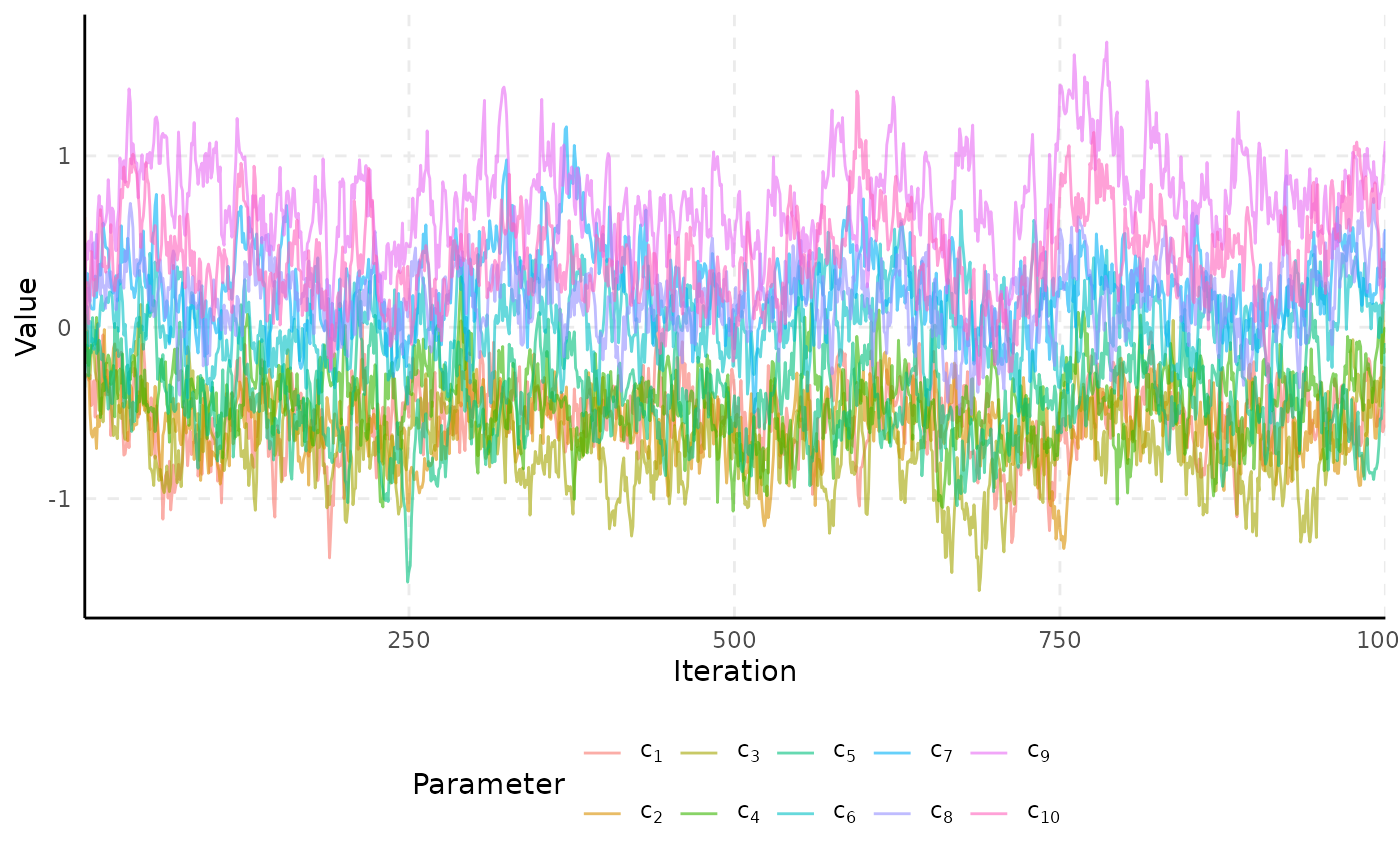
others sharing the same axis) or overlaid (facet = FALSE; all
series on a single panel, for a quick glance at overall convergence).
Usage
plot_trace(
  x,
  select,
  facet = TRUE,
  burnin = 0,
  thin = 1,
  nshow = 10,
  ncol = 1,
  legend = NULL,
  ...
)
Arguments
- x
A fitted
spifamodel.- select
Parameters to plot, passed to the
variableargument ofsubset_draws: either a group name (e.g."A", matching every parameter in that group) or one or more full indexed names (e.g."c[1]",paste0("A[", 1:10, ",1]")).- facet
Logical; if
TRUE(default), draw one panel per parameter; ifFALSE, overlay every series on a single panel. See Description.- burnin
Number of initial iterations to discard.
- thin
Thinning interval applied after
burnin.- nshow
If
selectmatches more thannshowparameters, a random (sorted) subsample ofnshowof them is shown instead of all of them. Set toNULLto always show every matched parameter.- ncol
Number of columns in the facet grid (
facet = TRUEonly); defaults to a single column.- legend
Legend position (
facet = FALSEonly): one of"bottom","right","none", or a logical. Defaults toNULL, which shows the legend unless there are more than 10 series, since a legend that large stops being readable and can dwarf the plot itself.- ...
Currently unused.
Examples
# \donttest{
data(ipixuna)
samples <- spifa(items ~ 1, data = ipixuna, nfactors = 3, ngp = 0, niter = 1000)
plot_trace(samples, select = "c", facet = TRUE)
 plot_trace(samples, select = "c", facet = FALSE)
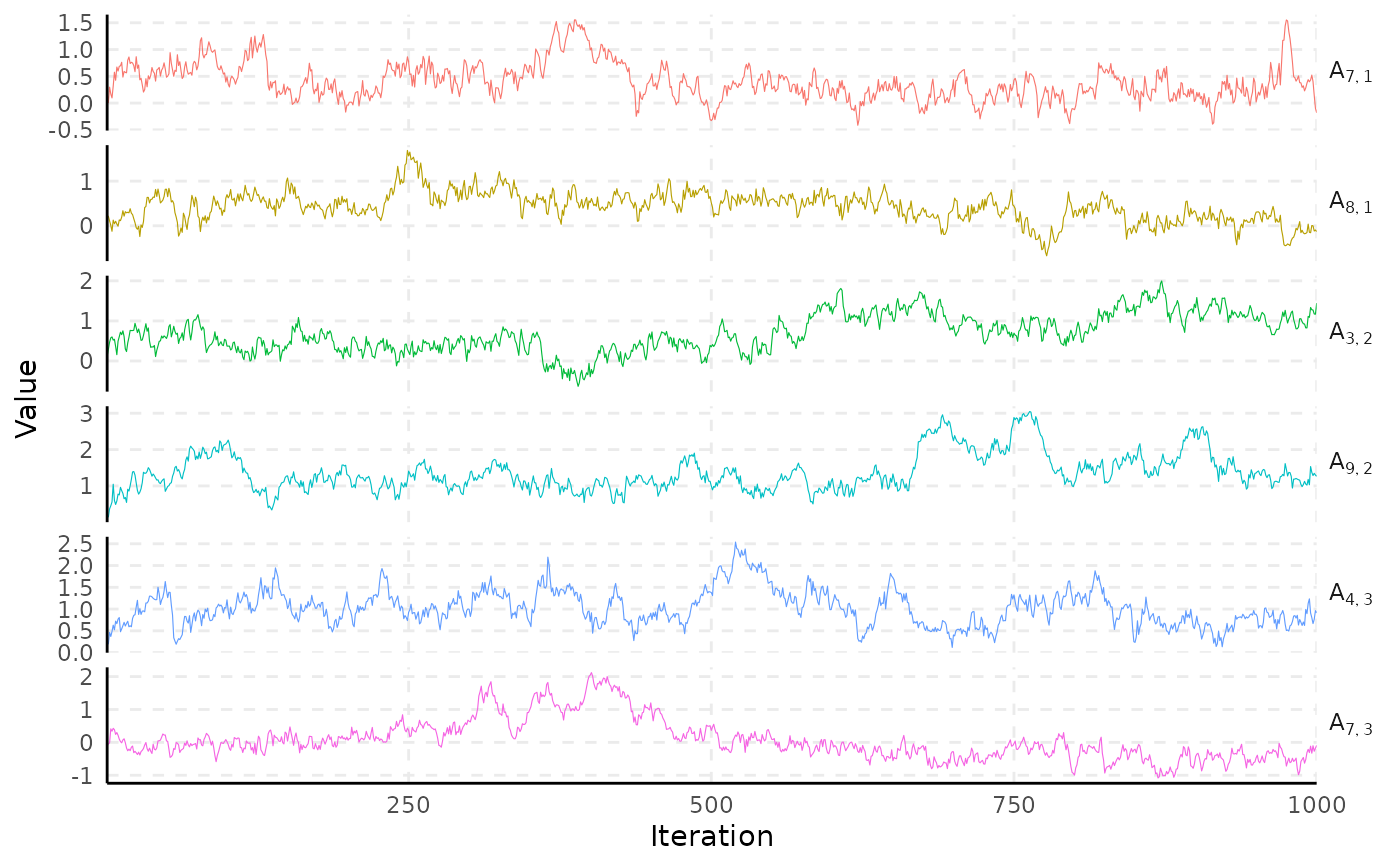
 # more than nshow (10) parameters: a random subsample is shown
plot_trace(samples, select = "A", facet = TRUE, nshow = 6)
# more than nshow (10) parameters: a random subsample is shown
plot_trace(samples, select = "A", facet = TRUE, nshow = 6)
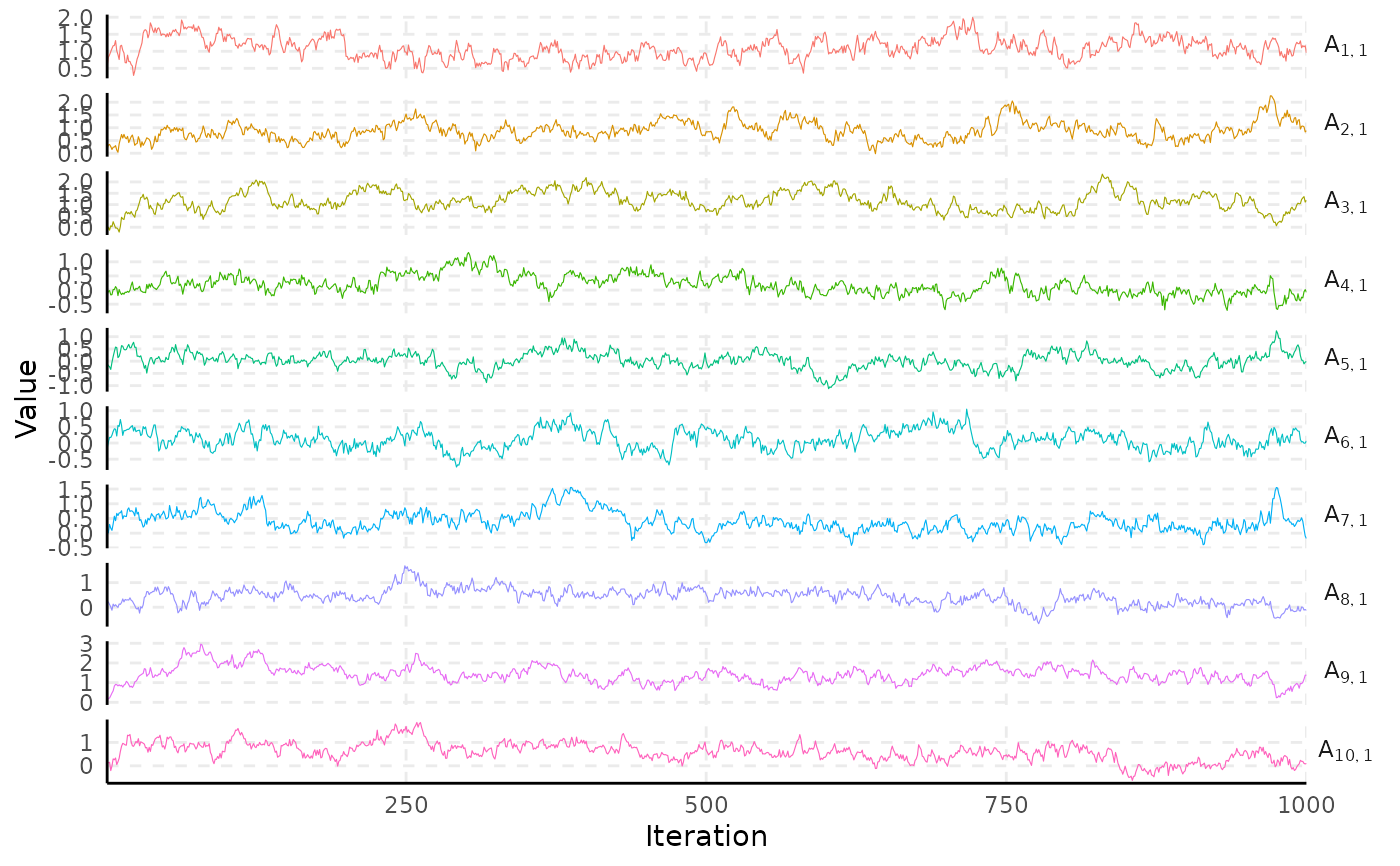
 # explicit selection instead of a random subsample
plot_trace(samples, select = paste0("A[", 1:10, ",1]"), facet = TRUE)
# explicit selection instead of a random subsample
plot_trace(samples, select = paste0("A[", 1:10, ",1]"), facet = TRUE)
 # }
# }