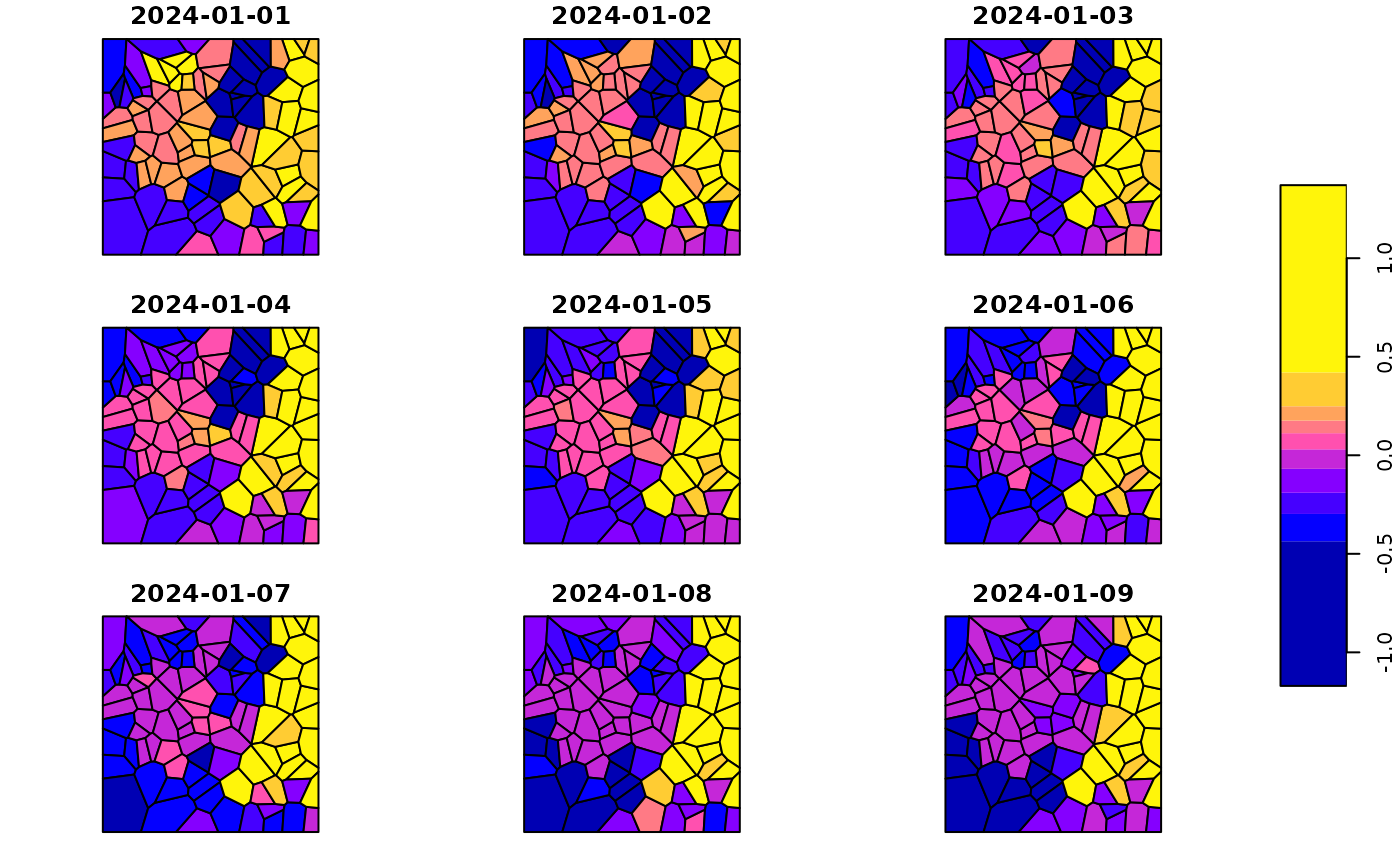
A simulated stars object containing Gaussian response data with a functional
clustering pattern uging random walk processes. This dataset includes the response
variable y observed across 100 simulated spatial regions over 91 time points.
Usage
data(stgaus)Examples
library(sfclust)

data(stgaus)
stgaus
#> stars object with 2 dimensions and 1 attribute
#> attribute(s):
#>         Min.    1st Qu.    Median          Mean   3rd Qu.     Max.
#> y  -1.170275 -0.2390084 0.0302046 -0.0004274323 0.2095926 1.370593
#> dimension(s):
#>          from  to     offset  delta refsys point
#> geometry    1 100         NA     NA     NA FALSE
#> time        1  91 2024-01-01 1 days   Date FALSE
#>                                                                 values
#> geometry POLYGON ((59.5033 683.285...,...,POLYGON ((942.7562 116.89...
#> time                                                              NULL
plot(stgaus["y"])
#> Warning: plotting the first 9 out of 91 attributes; use max.plot = 91 to plot all